Statistics & Patterns
Performance Overview
How to read the statistics dashboard and interpret your performance trends.
Overview
The Statistics page aggregates data from all your imported races to give you a bird's-eye view of your performance over time.
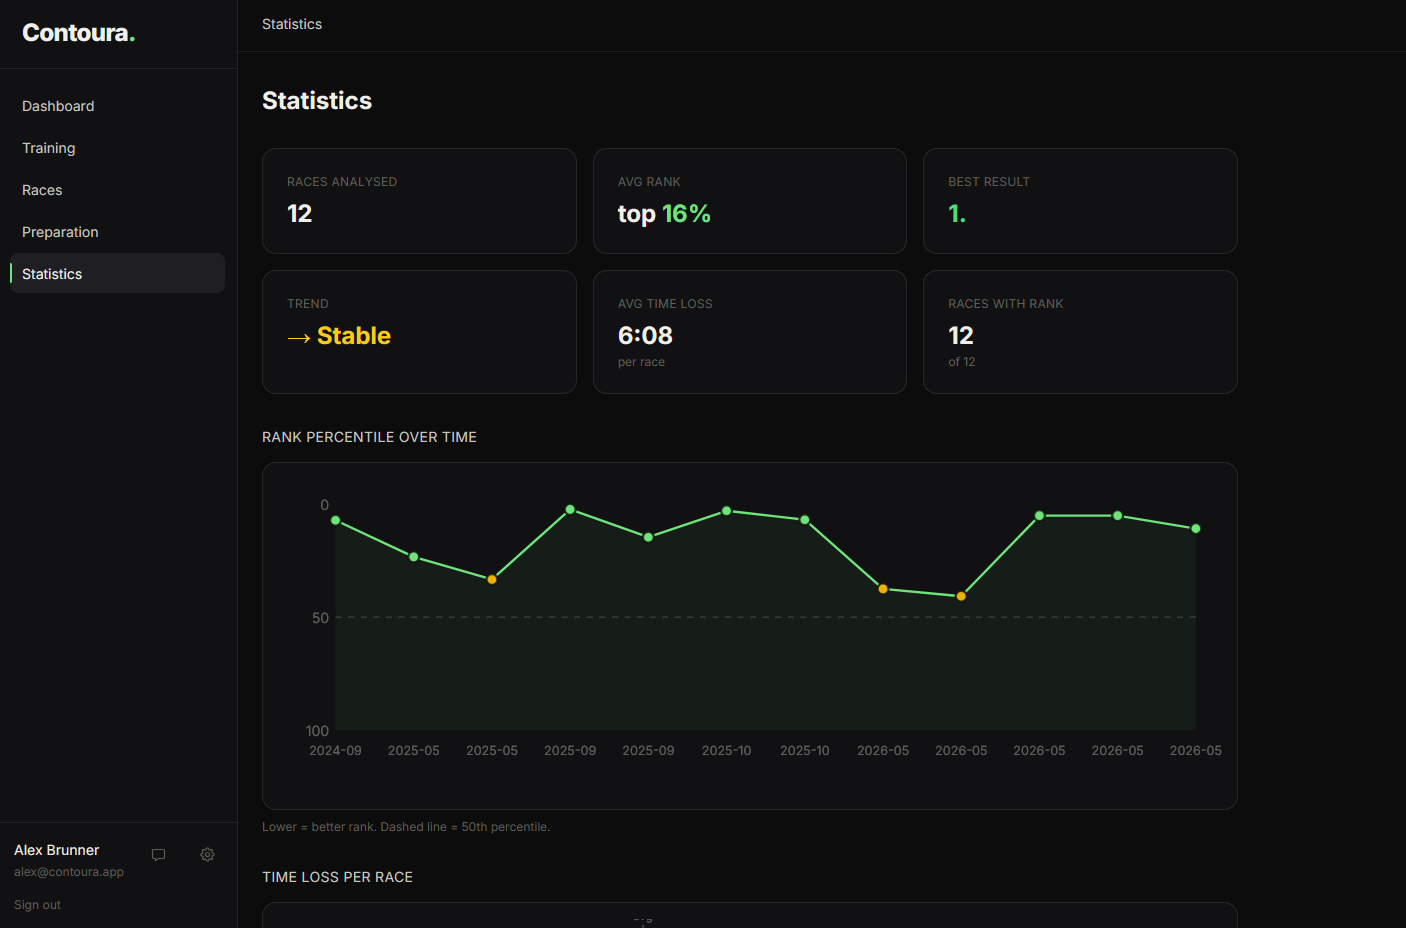
What is shown
- Total races imported
- Average time loss per leg across all races
- Performance trend — whether you are improving, stable, or declining
- Your self-assessment ratings over time, per dimension
- Recent race summary cards with key stats
Performance trend
The trend indicator compares your most recent races to your earlier ones. A downward trend in average time loss means you are getting faster and more consistent.